
What do owner-operators actually earn after expenses? The answer varies dramatically, from drivers losing money to operators netting $100,000+ annually, and the difference almost always comes down to understanding and controlling your numbers.
Here's what the data says about owner-operator profit margins in 2026 and what you can do to be at the top of the range.
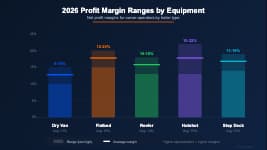
Average Owner-Operator Profit Margins in 2026
Based on data from ATBS (American Trucking Business Services) and industry benchmarks:
| Category | Revenue/Mile | Cost/Mile | Margin |
|---|---|---|---|
| Bottom quartile | $2.05 | $2.10+ | Negative / Break-even |
| Average | $2.35 | $1.82 | ~15–20% |
| Top quartile | $2.65+ | $1.70 | 30–40% |
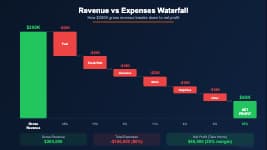
Key stat: The average owner-operator running 120,000 miles/year at $2.35/mile earns $282,000 in gross revenue. At a 15% net margin, that's $42,300 in annual profit, before paying yourself a salary.
The top quartile running at $2.65/mile with well-controlled costs at $1.70/mile nets $114,000+ annually.
What "Profit Margin" Actually Means for Truckers
Profit margin = (Revenue – All Costs) ÷ Revenue × 100
But there's a nuance for owner-operators: your profit is your pay. Unlike a W-2 employee, your business profit is what you pay yourself. So a 15% margin isn't bad. It's roughly what a well-run small business earns.
What separates top earners isn't usually revenue rate. It's cost control and load selection. Owner-operators who work with a dispatch service consistently land in the top quartile because a professional dispatcher optimizes both sides of that equation simultaneously.
The Math Behind the Difference
Average operator:
- Rate: $2.35/mile × 10,000 miles/month = $23,500/month gross
- Costs: $1.82/mile × 10,000 = $18,200
- Net: $5,300/month = $63,600/year (before taxes)
Top operator:
- Rate: $2.65/mile × 10,500 miles/month = $27,825/month gross
- Costs: $1.68/mile × 10,500 = $17,640
- Net: $10,185/month = $122,220/year (before taxes)
The difference is $58,000/year from a $0.30/mile rate improvement and $0.14/mile cost reduction.
Calculate your current numbers with our Trucking Profit Calculator.
What Drives Owner-Operator Profitability
1. Rate Per Mile (Biggest Single Factor)
The difference between $2.20/mile and $2.65/mile is enormous at volume. Strategies:
- Niche freight: Specialized freight (hazmat, oversized, temperature-controlled) pays premium
- Direct shippers: Bypass brokers for better rates on consistent lanes
- Avoid spot market pressure: Build relationships with reliable brokers and shippers
- Know your minimum rate: Never take a load below your cost per mile x 1.25
2. Cost Per Mile Control
Your Cost Per Mile Calculator shows your number. Top operators keep costs under $1.70/mile by:
- Preventive maintenance: Avoiding breakdowns that cost $5,000–$20,000
- Fuel efficiency: Speed management, less idling, route optimization
- Insurance shopping: Rates vary $300–$500/month for the same coverage
- Truck payment management: A lower truck payment has a massive compounding effect
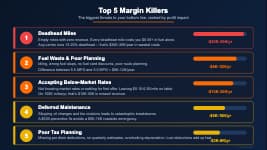
3. Deadhead Miles (Biggest Hidden Cost)
Industry average deadhead is 15–20%. Top operators run under 10%.
At 10,000 loaded miles/month and $1.82/mile cost, the difference between 10% and 20% deadhead is:
- 10% deadhead: 1,000 empty miles = $1,820 cost, zero revenue
- 20% deadhead: 2,000 empty miles = $3,640 cost, zero revenue
- Annual difference: $21,840
Use the Deadhead Calculator before accepting any load.
4. Load Selection Discipline
The most profitable operators reject bad loads. A load that barely covers costs isn't better than parking. It adds wear, hours, and risk while producing near-zero profit.
Use the Load Profitability Calculator to evaluate every load before accepting.
Factors Lowering Your Margins in 2026
Fuel prices: Diesel averaged $3.80/gallon nationally in early 2026. Every $0.10/gallon increase at 6.5 MPG costs $0.015/mile. At 120,000 miles/year, that's $1,800/year.
Insurance rates: Commercial trucking insurance rose 8–12% in 2025. New authority (under 2 years) operators pay 30–50% more.
Maintenance costs: Older trucks (5+ years) require more maintenance. Budget $0.18–$0.25/mile for aging equipment.
Broker fees: Most spot market loads carry a 15–20% broker margin. If the all-in rate was $2.50/mile, the load may have paid $3.00/mile to the broker. Direct shipper relationships capture that margin.
How to Calculate Your Actual Profit Margin
- Go to the Trucking Profit Calculator
- Enter your real revenue rate and miles per month
- Enter every fixed and variable cost (use 3-month averages)
- See your monthly net profit, annual profit, and profit margin percentage
Be honest with the numbers. The calculator can only tell you the truth if you give it real inputs.
What a "Good" Owner-Operator Profit Margin Looks Like
- Under 10%: Danger zone. One breakdown or slow month wipes out profit
- 10–20%: Average. Sustainable but limited flexibility
- 20–30%: Good. Building real equity and can absorb setbacks
- 30%+: Excellent. Operator is doing multiple things right
Most owner-operators who struggle financially are in the 0–10% range without knowing it. The ones who succeed track their numbers monthly.
Data sources: ATBS Owner-Operator Benchmarks 2025, DAT Freight & Analytics, U.S. EIA diesel price data.