Empty Miles Are Killing Your Profit. Here's How to Fix It.
100 miles of deadhead at $0.65/mile in fuel costs is $65 you paid to go nowhere. Most operators undercount this. Here's how to stop.
Six Strategies
How Dispatchers Keep Deadhead Under 10%
Deadhead is the margin killer that most operators undercount because they never add it up. Here's how we keep it under 10% - and what that difference is actually worth.
Book the Next Load Before You Deliver
The most common deadhead mistake: finishing a delivery and then starting to look. By then the good loads are already gone. We start working your next load 4-6 hours before your delivery window.
Pick Lanes That Pay Both Ways
Some corridors have freight moving in both directions. Others leave you repositioning 300 miles empty every single week. We look at round-trip viability before we commit you to a lane.
Work Destination Markets in Advance
If you're delivering to Dallas, we're working Dallas-originating contacts before you get there - not after. The difference between finding a backhaul and running empty often comes down to whether you called ahead.
Lower Rate vs. Long Deadhead: Run the Math
Sometimes a $1.90/mile load with no repositioning beats a $2.30/mile load that requires 180 miles of empty driving to reach. We run that calculation on every load, every time.
Move Before You're Stuck
When freight density in a market shifts, we tell you before you're sitting idle. Repositioning proactively when a market softens costs far less than waiting until there's nothing.
Eyes on Your Destination While You Drive
While you're rolling toward delivery, we're watching load availability at your drop point in real time. The best loads post and book fast - we catch them before they're gone.
The Numbers
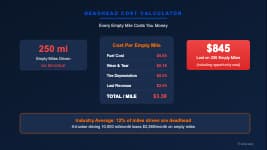
The Real Cost of Deadhead Miles (And How Top Carriers Beat It)
The industry average deadhead ratio for solo OTR runs 15–20%. That means on 10,000 miles a month, up to 2,000 of those miles earned you nothing. Drivers running dedicated laneswith solid dispatch support consistently sit at 8–12%. The gap between those two numbers - 8% vs 18% deadhead on 10,000 monthly miles - is 1,000 miles. At $0.65/mile all-in cost, that's $650 a month you're paying to drive nowhere. Over a year, that's $7,800. Most operators who add that up for the first time are surprised by the number.
The math on individual decisions matters too. Take two loads: one pays $2.20/mile on a 400-mile run but requires 180 miles of empty positioning to reach the pickup. The other pays $1.85/mile but is 15 miles from your current location. Load A grosses $880 but costs you $117 in deadhead first - net yield is $763. Load B grosses $740 with virtually no repositioning cost. That's a $23 difference in actual earnings, not the $140 that the rate-per-mile comparison suggests. When you run this math on every load decision, the numbers that look obvious on a rate sheet start looking very different.
The most reliable deadhead reduction comes from lane discipline, not constant optimization. A triangle route - Chicago south to Dallas, Dallas to Houston, Houston to Atlanta - consistently produces sub-8% deadhead because all three legs carry viable freight in both directions. Carriers who chase the highest rate on every individual load without thinking about where that load leaves them often end up repositioning 200-300 miles before their next pickup. One great rate that strands you in a thin freight market - and leaves you unable to find a backhaul - costs more than two average rates that keep you moving in a loop.
Dispatchers have a practical advantage in deadhead management that comes from working multiple carriers simultaneously. When two trucks are in the same market on the same day, a dispatcher can cross-reference outbound loads going to each truck's destination and return loads coming back. One truck takes the outbound, the other takes the return. Both get loaded miles. That kind of matching is hard to do when you're a solo owner-operator only thinking about your own truck.
- Work triangle routes (Chicago–Dallas–Houston–Atlanta) - all three legs carry freight both ways
- Start looking for the next load 4–6 hours before delivery - not after you drop the trailer
- Do the break-even math - a lower-rate load with no deadhead often beats the "better" rate 150 miles away
- Call destination markets before you arrive - backhaul loads go to whoever asked first
- Track your deadhead percentage every week - if you're not watching it, it drifts up without you noticing
Deep Dive
Backhaul Strategy by Equipment Type
Every mile you drive without freight is a mile you're paying for out of your own pocket. The owner-operators who consistently outperform the market aren't necessarily finding better-paying loads. They're simply driving fewer empty miles. Backhaul loads are the single most powerful lever for improving your per-mile profitability without changing a single thing about your rates.
Why Backhauls Matter More Than Rate Per Mile
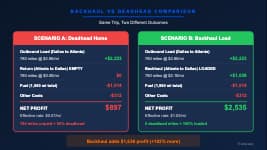
Consider this example:
Scenario A
Chicago → Atlanta at $2.80/mile (800 mi), then 400 mi deadhead to Nashville for next pickup
1,200 miles, $2,240 earned
Scenario B
Chicago → Atlanta at $2.80/mile (800 mi), then backhaul at $2.20/mile to Louisville (350 mi), then 50 mi to Nashville
1,200 miles, $3,010 earned
The backhaul paid less per mile than the outbound. It didn't matter. It generated $770 more revenue on the same number of driving hours.
Find Backhauls Before You Deliver
- 1Know your drop point 24–48 hours out. As soon as you confirm your delivery appointment, you know your exact location and timing.
- 2Search a radius, not a pinpoint. Don't only search loads departing from your exact delivery city - search a 100–150 mile radius.
- 3Contact your dispatcher or agent first. A good dispatcher starts working your backhaul the day before your delivery, not the morning of.
- 4Use carrier relationships. Call other owner-operators in your network who run that region.

Strategies by Equipment Type
Dry Van Backhaul
Most backhaul freight volume in the country, but every other dry van carrier is looking too. Use freight agents who specialize in regional markets, target less-obvious routing (freight going 80% of the way home at a higher rate per mile), and build a "return lane" list of 3–5 reliable backhaul regions from your most common delivery cities.
Reefer Backhaul
Commands premium backhaul rates during produce season (April–October) but faces rate pressure in winter when produce volume drops. Best corridors: California Central Valley → East Coast (outbound) / consumer goods → California (backhaul); Florida → Midwest (outbound) / general merchandise → Southeast (backhaul).
Flatbed Backhaul
The hardest equipment type to find consistent backhauls for. Steel service centers (Ohio, Pennsylvania, Texas) generate consistent outbound freight and often need return loads. Construction supply markets (Texas, Florida, Southeast) are building heavily. Reverse-route plan to deliver in regions with strong flatbed backhaul volume.
Common Backhaul Corridors
| Outbound Lane | Strong Backhaul Options | Equipment |
|---|---|---|
| Midwest → Southeast | Southeast → Midwest (produce, consumer goods) | Dry Van, Reefer |
| Southeast → Northeast | Northeast → Southeast (retail returns, consumer goods) | Dry Van |
| Texas → Midwest | Midwest → Texas (manufactured goods, retail) | Dry Van, Flatbed |
| West Coast → Midwest | Midwest → West Coast (consumer goods, electronics) | Dry Van, Reefer |
| Florida → Anywhere | Anything into Florida (retail, food service) | Dry Van, Reefer |
Concrete Profit Math: 25% to 15% Deadhead
Assume 10,000 loaded miles per month, current deadhead rate 25% (2,500 deadhead miles), average loaded rate $2.50/mile, variable cost per mile $0.85.
Current
- Revenue: $25,000
- Total costs: 12,500 mi × $0.85 = $10,625
- Gross profit: $14,375
After reducing to 15%
- Revenue: $25,000 + $2,500 (1,000 backhaul miles at avg rate) = $27,500
- Total costs: 11,500 mi × $0.85 = $9,775
- Gross profit: $17,725
That's a $3,350/month improvement, not from higher rates - just from fewer empty miles. Verify with the profit calculator.
Deadhead Questions
Frequently Asked Questions
Deadhead Wins
Carriers Who Cut the Empty Miles
Backhauls, positioning loads, and lane planning that actually works.
“I've got two dry vans. During the slow season last month, they were the reason I didn't park the trucks. They managed to find backhauls that kept me out of the deadhead trap. Consistent, professional, and they don't hide the numbers.”
Robert M.
Denver, CO
Small fleet · 2 dry vans“Running a 2-truck fleet is a lot of phone time. Since outsourcing to TruckLeap, my focus is back on maintenance. They treat my drivers like pros and keep our deadhead below 8%. Highly recommend for small fleet owners.”
Marcus D.
Atlanta, GA
Small fleet · 2 flatbeds“I was tired of getting lowballed by brokers who knew I was empty in a dead zone. TruckLeap got me a backhaul out of Laredo that actually covered my fuel and then some. They don't just find loads; they strategize my whole week so I'm not sitting on my hands.”
Pavel G.
Philadelphia, PA
Solo · 2022 Kenworth dry vanStop Paying to Drive Empty. Let Us Plan Your Next Load.
Apply in 5 minutes. We'll start working your lanes and cutting empty miles within 48 hours.
Apply Now - Free Setup