Best-Paying Freight Lanes: 2026 Rate Guide
Top 100 US freight lanes ranked by avg rate per mile. Rates, distances, dominant equipment, difficulty ratings, and profitability data, updated for 2026.
Lane Intelligence
Not All Freight Lanes Are Created Equal
The difference between a $2.10/mile load and a $2.80/mile load on the same route usually comes down to one thing: information. Drivers who know which lanes have consistent freight, which carriers are oversaturated, and when to position for peak demand consistently outperform drivers who guess.
Our lane intelligence database covers the 100 highest-volume freight corridors in the United States. Each lane includes average rate data, estimated toll and fuel costs, dominant equipment types, difficulty ratings based on carrier density, and return freight availability. Everything you need to decide whether a load is worth taking before you commit.
Use this data alongside our Load Profitability Calculator to run a full cost analysis before accepting any load. A $2.50/mile gross rate with $0.40 in tolls and a deadhead return is often less profitable than a $2.20/mile load with a clean backhaul.
100
Freight Lanes Tracked
$2.20
Avg Rate/Mile
68%
Have Return Freight
Free
All Data, No Paywall
How to Use This
Reading Lane Data Like a Pro
01
Check the difficulty rating
Easy = freight plentiful, negotiate up. Moderate = solid rates, book mid-week. Competitive = you need a dispatcher or direct shipper to hit top rates.
02
Calculate real net pay
Subtract fuel estimate, tolls, and your actual operating costs from gross rate. A $2.60/mile load with $50 in tolls on a 400-mile run nets less than you think.
03
Plan the return before you leave
Check if a return lane is available. Drivers who plan both legs of the trip gross 20-35% more per week than drivers who deadhead back empty.
Highest Paying Lanes
Top 10 Featured Freight Lanes
NY → MA · 215 miles
$2.90/mile
Avg gross: $624
PA → NY · 97 miles
$2.85/mile
Avg gross: $277
MA → NY · 215 miles
$2.85/mile
Avg gross: $613
CA → WA · 1,135 miles
$2.80/mile
Avg gross: $3,178
NY → PA · 97 miles
$2.80/mile
Avg gross: $272
IL → NY · 790 miles
$2.80/mile
Avg gross: $2,212
NY → IL · 790 miles
$2.75/mile
Avg gross: $2,173
MD → PA · 101 miles
$2.75/mile
Avg gross: $278
WA → CA · 1,135 miles
$2.75/mile
Avg gross: $3,121
GA → FL · 662 miles
$2.70/mile
Avg gross: $1,787
All Lanes
All Lanes by Origin State
Los Angeles → Dallas
1,435 mi · Dry Van, Reefer
$2.65/mi
San Francisco → Los Angeles
381 mi · Dry Van, Reefer
$2.60/mi
Los Angeles → San Francisco
381 mi · Dry Van, Reefer
$2.55/mi
Sacramento → Los Angeles
384 mi · Dry Van, Reefer
$2.55/mi
Los Angeles → Sacramento
384 mi · Dry Van, Reefer
$2.50/mi
Fresno → Los Angeles
220 mi · Dry Van, Reefer
$2.45/mi
Los Angeles → Phoenix
372 mi · Dry Van, Reefer
$2.40/mi
Miami → Atlanta
662 mi · Dry Van, Reefer
$2.65/mi
Tampa → Atlanta
467 mi · Dry Van, Reefer
$2.55/mi
Jacksonville → Atlanta
346 mi · Dry Van, Reefer
$2.50/mi
Orlando → Miami
236 mi · Dry Van, Reefer
$2.50/mi
Miami → Orlando
236 mi · Dry Van, Reefer
$2.45/mi
Orlando → Tampa
84 mi · Dry Van, Reefer
$2.40/mi
Tampa → Orlando
84 mi · Dry Van, Reefer
$2.35/mi
Atlanta → Charlotte
245 mi · Dry Van, Reefer
$2.55/mi
Atlanta → Dallas
781 mi · Dry Van, Reefer
$2.50/mi
Atlanta → Chicago
716 mi · Dry Van, Reefer
$2.45/mi
Atlanta → Jacksonville
346 mi · Dry Van, Reefer
$2.45/mi
Atlanta → Memphis
391 mi · Dry Van, Reefer
$2.40/mi
Atlanta → Nashville
248 mi · Dry Van, Flatbed
$2.35/mi
Atlanta → Birmingham
148 mi · Dry Van, Flatbed
$2.30/mi
Chicago → Atlanta
716 mi · Dry Van, Reefer
$2.50/mi
Chicago → Dallas
917 mi · Dry Van, Flatbed
$2.45/mi
Chicago → Houston
1,092 mi · Dry Van, Flatbed
$2.40/mi
Chicago → Minneapolis
410 mi · Dry Van, Reefer
$2.35/mi
Chicago → Kansas City
510 mi · Dry Van, Reefer
$2.35/mi
Chicago → Detroit
281 mi · Dry Van, Flatbed
$2.30/mi
Chicago → Indianapolis
183 mi · Dry Van, Flatbed
$2.20/mi
Memphis → Atlanta
391 mi · Dry Van, Reefer
$2.45/mi
Nashville → Charlotte
409 mi · Dry Van, Flatbed
$2.45/mi
Nashville → Atlanta
248 mi · Dry Van, Reefer
$2.40/mi
Memphis → Indianapolis
467 mi · Dry Van, Reefer
$2.35/mi
Memphis → Nashville
209 mi · Dry Van
$2.30/mi
Nashville → Memphis
209 mi · Dry Van
$2.25/mi
Memphis → Little Rock
139 mi · Dry Van, Reefer
$2.15/mi
Laredo → San Antonio
155 mi · Dry Van, Reefer
$2.70/mi
El Paso → Dallas
625 mi · Dry Van, Reefer
$2.65/mi
Dallas → Houston
239 mi · Dry Van, Flatbed
$2.60/mi
Dallas → Los Angeles
1,435 mi · Dry Van, Reefer
$2.60/mi
San Antonio → Laredo
155 mi · Dry Van, Reefer
$2.60/mi
Dallas → Atlanta
781 mi · Dry Van, Reefer
$2.55/mi
Dallas → Denver
1,020 mi · Dry Van, Flatbed
$2.55/mi
Houston → Dallas
239 mi · Dry Van, Flatbed
$2.55/mi
Dallas → El Paso
625 mi · Dry Van, Reefer
$2.55/mi
Dallas → Phoenix
1,067 mi · Dry Van, Reefer
$2.50/mi
Houston → San Antonio
197 mi · Dry Van, Flatbed
$2.50/mi
Dallas → San Antonio
278 mi · Dry Van, Flatbed
$2.45/mi
Houston → New Orleans
355 mi · Dry Van, Flatbed
$2.45/mi
San Antonio → Houston
197 mi · Dry Van, Flatbed
$2.45/mi
Dallas → Chicago
917 mi · Dry Van, Reefer
$2.40/mi
Houston → Chicago
1,092 mi · Flatbed, Dry Van
$2.35/mi
Dallas → Oklahoma City
207 mi · Dry Van, Flatbed
$2.30/mi
Dallas → Tulsa
265 mi · Dry Van, Flatbed
$2.25/mi
Lane Economics
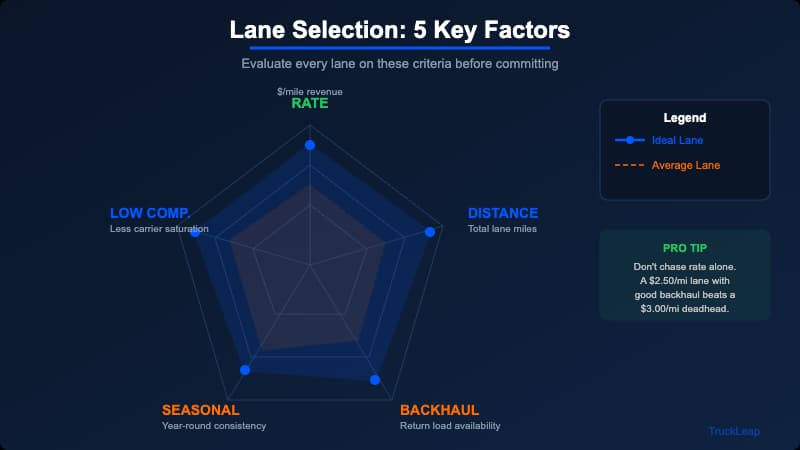
What Makes a Lane High-Paying?
Freight rates are not evenly distributed across the country. A dry van running the same miles from Los Angeles to Phoenix earns dramatically less per mile than the same truck running Atlanta to New York. Understanding where the freight imbalances are - and positioning your truck to exploit them - is one of the highest-leverage moves an owner-operator can make.
Rates on a given corridor are driven by supply-demand imbalance. Lanes pay more when:
More freight leaves a region than enters it: Trucks flow toward volume but need to get home, creating backhaul scarcity.
Freight requires specialized equipment: Flatbed, reefer, and hazmat freight commands premiums over dry van.
Seasonal demand spikes: Produce season, retail peak, and agricultural harvests create temporary rate surges.
Geographic constraints: Long hauls from low-density areas (mountain states, rural Southeast) push rates up because fewer trucks are positioned there.
Top 15 Corridors
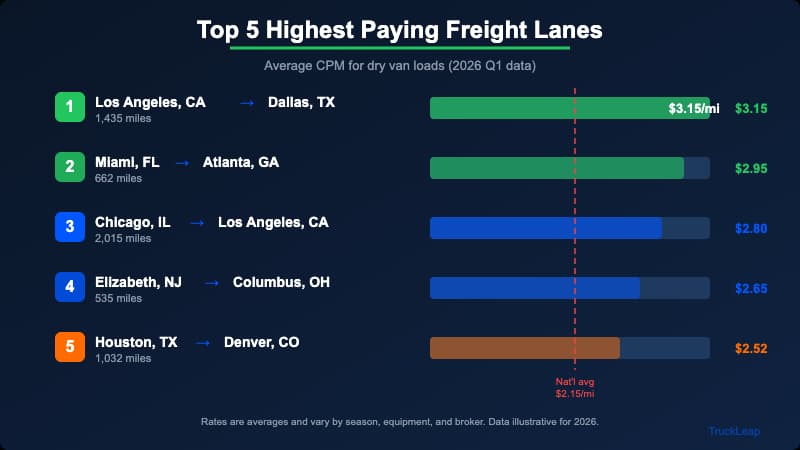
The 15 Best-Paying Freight Lanes in 2026
Spot market ranges as of Q1 2026, drawn from carrier-reported rate confirmations and DAT spot data. Contract rates vary; seasonal fluctuations can move these 20–40% above or below the listed ranges.
| # | Origin | Destination | Avg Rate/Mile | Equipment | Notes |
|---|---|---|---|---|---|
| 1 | Atlanta, GA | New York, NY | $3.10–$3.50 | Dry Van, Reefer | Southeast → Northeast imbalance |
| 2 | Laredo, TX | Chicago, IL | $2.90–$3.30 | Dry Van | Cross-border import freight |
| 3 | Fresno, CA | Boston, MA | $3.20–$3.80 | Reefer | Produce season (Apr–Oct) |
| 4 | Charlotte, NC | Chicago, IL | $2.80–$3.20 | Dry Van, Flatbed | Manufacturing outbound |
| 5 | Memphis, TN | New York, NY | $2.90–$3.20 | Dry Van | Distribution hub outbound |
| 6 | Savannah, GA | Columbus, OH | $2.70–$3.10 | Dry Van | Port freight distribution |
| 7 | Dallas, TX | Atlanta, GA | $2.60–$3.00 | Dry Van, Reefer | Bidirectional, solid backhaul |
| 8 | Detroit, MI | Dallas, TX | $2.70–$3.10 | Flatbed, Dry Van | Auto parts + manufacturing |
| 9 | Miami, FL | Chicago, IL | $2.80–$3.30 | Reefer | Florida produce + retail |
| 10 | El Paso, TX | Phoenix, AZ | $2.50–$2.90 | Dry Van | Import freight westbound |
| 11 | Seattle, WA | Chicago, IL | $2.90–$3.40 | Dry Van, Reefer | Pacific Northwest long haul |
| 12 | Kansas City, MO | Atlanta, GA | $2.60–$3.00 | Dry Van | Manufacturing mid-south |
| 13 | Houston, TX | Chicago, IL | $2.70–$3.10 | Flatbed, Dry Van | Energy sector + general |
| 14 | Nashville, TN | New York, NY | $2.80–$3.20 | Dry Van | Automotive + consumer goods |
| 15 | Jacksonville, FL | Baltimore, MD | $2.70–$3.10 | Dry Van, Reefer | East Coast port freight |
Several of these corridors have dedicated lane pages with mileage, fuel estimates, and return-lane availability - including the Dallas to Atlanta corridor.
Regional Breakdown
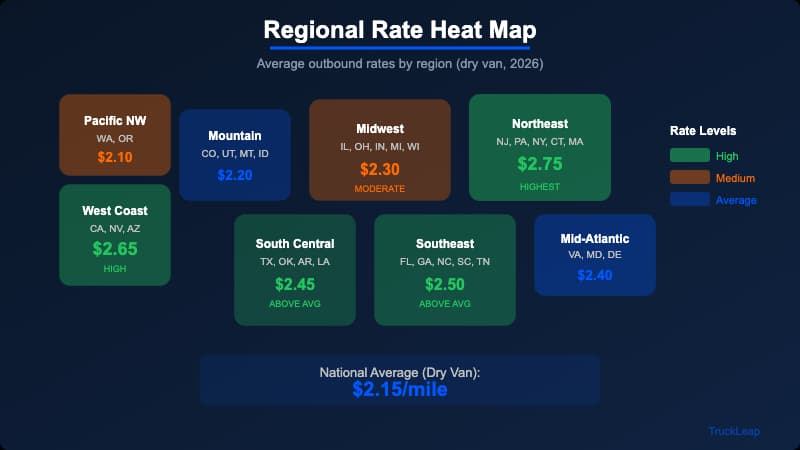
Lane Analysis by Region
Southeast → Northeast: The Best Structural Imbalance in Trucking
The Southeast-to-Northeast corridor (Atlanta, Charlotte, Nashville, and Jacksonville feeding New York, Baltimore, Philadelphia, and Boston) is consistently one of the best-paying corridors in the country. Why? The Northeast consumes far more than it produces. It imports goods from the Southeast, Midwest, and international ports, but relatively little moves back south in volume.
This creates persistent backhaul pressure: trucks running north need to find freight south, often accepting below-market rates to reposition. If you're running outbound from the Southeast, you're on the right side of this imbalance.
Best equipment for this corridor: Dry van and reefer. The Southeast generates significant produce freight (Florida, Georgia) and consumer goods from distribution centers - check the dry van dispatch service for consistent access to pre-negotiated Southeast-Northeast loads.
Texas → Everywhere: Cross-Border Volume Creates Opportunity
Texas is one of the highest-volume freight states in the country, driven by cross-border trade with Mexico, energy sector activity, and a massive consumer population. The Laredo-to-Chicago lane in particular benefits from USMCA trade volume, with manufactured goods crossing from Mexico and moving north to the Midwest.
The catch: Texas also generates a lot of trucks. Competition for southbound loads out of major Texas cities is stiff, so positioning matters. Target the outbound lanes (Texas → Midwest, Texas → Southeast) rather than the inbound. Markets like Dallas and Houston have the deepest outbound pools.
Midwest Industrial Lanes: Flatbed Country
The industrial Midwest (Detroit, Columbus, Kansas City, and Chicago) is flatbed territory. Auto parts, steel, machinery, and construction materials move on flatbeds, and this freight generally pays $0.30–$0.60/mile more than comparable dry van lanes.
Detroit-to-Dallas is a standout lane for flatbed because automotive freight generates consistent volume in both directions (parts north, finished vehicles south). The distance (1,100+ miles) keeps per-load revenue strong even when per-mile rates dip. Carriers working Chicago outbound freight into the South also benefit from the manufacturing density that feeds these industrial corridors.
If you're running flatbed in the Midwest, our flatbed dispatch team specializes in industrial freight and has direct shipper relationships on these corridors.
West Coast Long Haul: High Rates, High Effort
The Seattle-to-Chicago and Fresno-to-Boston lanes pay very well per mile, but they're long hauls (1,700–3,000 miles) that require careful planning. The Pacific Northwest has a consistent freight deficit. It generates agricultural and manufactured goods that move east but doesn't pull as much volume back west. This structural imbalance keeps eastbound rates elevated.
Fresno-to-Boston is a produce season anomaly. During peak produce season (April–October), reefer rates on this lane can hit $4.00+/mile. Outside of produce season, rates normalize significantly. Plan your equipment positioning around the seasonal calendar.
Seasonality
Seasonal Rate Patterns to Plan Around
Freight cycles are predictable if you watch them. Position your equipment ahead of seasonal demand peaks rather than reacting after the rates move.
| Season | Impact | Which Lanes Benefit |
|---|---|---|
| Produce Season (Apr–Oct) | Reefer rates spike 30–60% | California → Northeast, Florida → Midwest |
| Retail Peak (Oct–Dec) | Dry van volume surges | All major distribution corridors |
| Auto Production (year-round, dips in Aug) | Flatbed demand consistent | Detroit, Ohio, Tennessee corridors |
| Agricultural Harvest (Sep–Nov) | Grain hopper demand peaks | Plains states, Iowa, Illinois outbound |
| Post-Holiday Slowdown (Jan–Feb) | Rates drop 15–25% across most lanes | Use this period to build direct shipper relationships |
Positioning Strategy
How to Position Your Truck for Better Lanes
Knowing the best-paying lanes is only half the equation. Getting your truck into them consistently is the other half.
- 1
Home base matters
If you're based in Atlanta, you're already positioned for some of the best structural outbound freight in the country. If you're based in Phoenix, you need a deliberate strategy to reach higher-rate corridors.
- 2
Run the numbers before repositioning
Deadheading 400 miles to reach a better lane can erase the rate advantage. Use our deadhead calculator to determine whether repositioning actually pays.
- 3
Build lane-specific relationships
The most consistent access to high-paying lanes comes from dispatcher relationships or direct shipper accounts on specific corridors - not from hunting load boards daily.
- 4
Consider a professional dispatcher
A dispatcher with broker relationships on your target lanes can consistently outperform spot market searching. See our dispatch pricing to check whether the economics work for your operation.
Profitability Check
Calculating Whether a Lane Is Actually Profitable
A high rate per mile doesn't automatically mean a profitable load. Before accepting any lane, account for the full cost of running it:
Deadhead miles to the pickup location
Fuel cost for the loaded and empty miles combined
Time value: a 2-day load at $3.00/mile may generate less weekly revenue than back-to-back 1-day loads at $2.60/mile
Run every significant load through our profit calculator to see actual take-home after costs. The best-paying lane in the country is a bad deal if your operating costs make it a breakeven proposition. For deeper city-by-city market data, the freight load insights hub covers the top 50 origin markets.
FAQ
Frequently Asked Questions About Freight Lanes
Running one of these lanes? Get loads that beat these rates.
Our dispatch team sources loads on every major US freight lane, often above posted spot rates. Apply free in under 5 minutes.
Apply for Dispatch Service